Understanding Widgets in vCOPS
All though I am using vCOPS On and Off for last couple of months. I thought, a short description of each widget will help to remember, what they do and how we can use them in the dashboard.
Advanced Health Tree Widget
The Advanced Health Tree widget shows the section of your resource hierarchy around any resources that you select. The widget shows the selected resource and its parent and child resources.
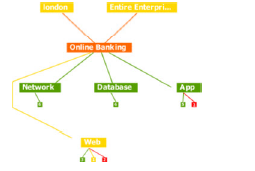 Advanced Health Tree Widget
Alerts Widget
The Alerts widget lists alerts for selected resources and provides a convenient way to view and manage alerts. When you double-click an alert in the Alerts widget, the Alert Summary page appears and shows more detailed information about the alert.
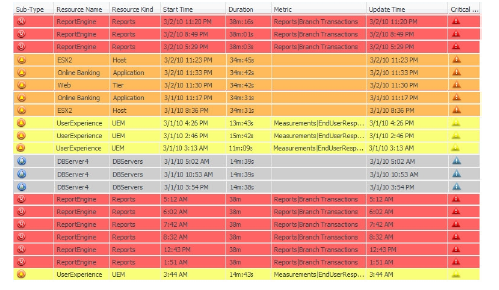 Alerts Widget
Application Detail Widget
The Application Detail widget shows information for a selected application. The top of the widget shows the number of tiers, resources, and metrics that the application contains and the number of Smart Alerts and classic alerts on the application. The Application Detail widget does not show information for child resources
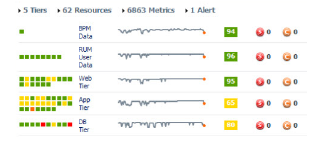 Application Detail Widget
Application Overview Widget
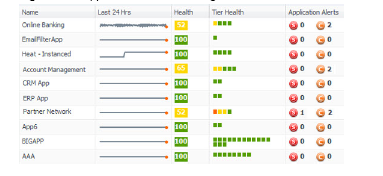
The Application Overview widget can list all of the applications in the enterprise, or only applications that you select. The widget shows a health graph for the last 24 hours, the current health score, the current health of each tier, and the number of alerts for the application itself. You can double-click an application to open its Application Detail page.
 Application Overview Widget
Configuration Overview Widget
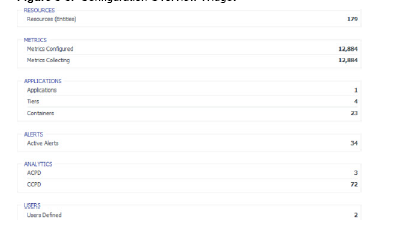
The Configuration Overview widget shows the current uptime functional status of defined resources, applications, and collected metrics for the environment.
 Configuration Overview Widget
Data Distribution Analysis Widget
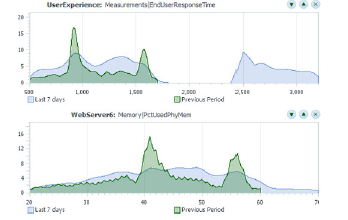
The Data Distribution Analysis widget shows a graph for selected metrics. For each metric, the graph shows the data distribution of the metric, including how often it had a particular value.
 Data Distribution Analysis Widget
Generic Scoreboard Widget
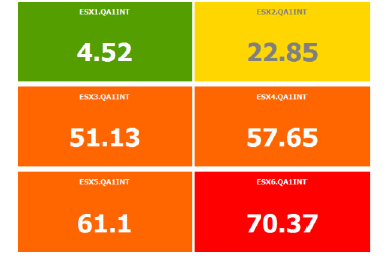
The Generic Scoreboard widget shows the current value for each metric that you select. Each metric appears in a separate box. The value of the metric determines the color of the box. You define the values for each color when you edit the widget. If you point to a box, the widget shows the source resource and metric data.
 Generic Scoreboard Widget
GEO Widget
If your configuration assigns values to the GEO Location resource tag, the GEO widget shows where your resources are located on a world map.
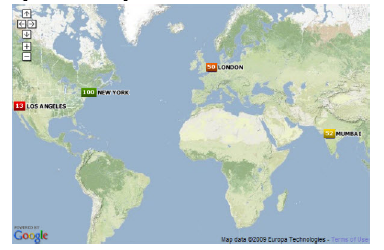 GEO Widget
Health Status Widget
The Health Status widget shows the health score for selected resources. Health status is a 0 to 100 ranking that vCenter Operations Manager determines for each resource. For each resource, the widget includes the current health score and a graph that shows how the health score has changed over time.
 Health Status Widget
Health Tree Widget
The Health Tree widget shows the section of your resource hierarchy around a resource that you select. The widget shows all of the parent container resources that hold the resource. If you select a container resource, the widget shows all of the child resources that the container holds.
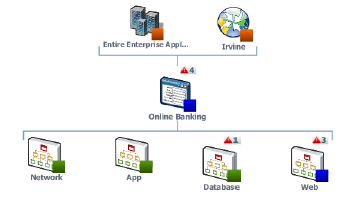 Health Tree Widget
Health-Workload Scoreboard Widget
The Health-Workload Scoreboard widget shows the health or workload score of selected resources. The icons for each resource are color coded. Green indicates best performance, which is 100 for health or 0 for workload. Red indicates worst performance, which is 0 for health or 100 for workload.
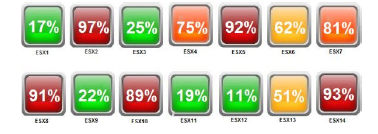 Health-Workload Scoreboard Widget
Heat Map Widget
The Heat Map widget contains graphical indicators that show the current value of two selected attributes for resources that belong to tag values that you select.
Mashup Charts Widget
The Mashup Charts widget contains charts that show different aspects of the behavior of a selected resource. By default, the charts show data for the past six hours
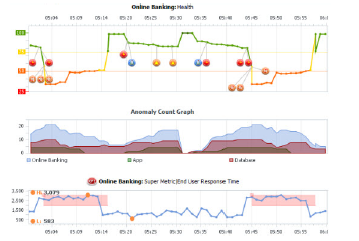 Mashup Charts Widget
Metric Graph Widget
The Metric Graph widget shows a graph of the recent performance, and predicted future performance, of a metric. The important metrics count, which a vCenter Operations Manager administrator sets, determines the number of metrics that appear in the Metric Graph widget.
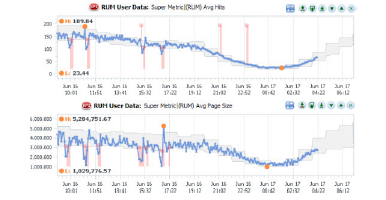 Metric Graph Widget
Metric Graph (Rolling View) Widget
The Metric Graph (Rolling View) widget shows a full chart for one selected metric at a time. Miniature graphs for the other selected metrics appear at the bottom of the widget.
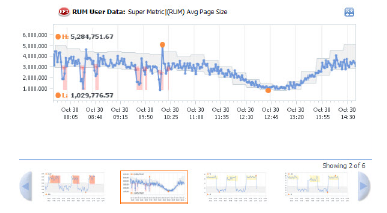 Metric Graph (Rolling View) Widget
Metric Selector Widget
The Metric Selector widget shows attribute packages for one or more resources that you select in the Alerts, Generic Scoreboard, Health Status, Health Tree, Health-Workload Scoreboard, Heat Map, Resources, Root Cause Ranking, VC Relationship, or VC Relationship (Planning) widget.
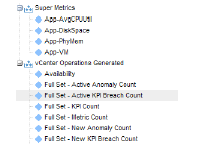 Metric Selector Widget
Metric Sparklines Widget
The Metric Sparklines widget shows simple graphs that contain the values of selected metrics over time and provides a quick view of the trends in KPIs.
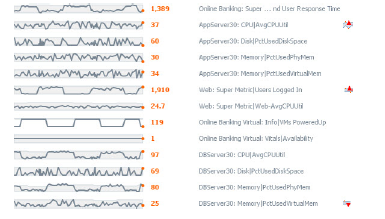 Metric Sparklines Widget
Metric Weather Map Widget
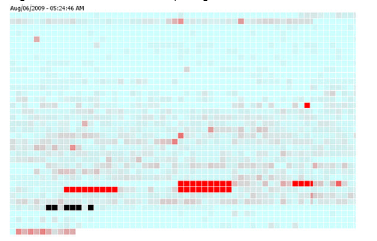
The Metric Weather Map widget provides a graphical display of the changing values of a single metric for multiple resources over time. The widget uses colored icons to represent each value of the metric. Each icon location represents the metric value for particular resources. The color of an icon changes to show changes in the value of the metric.
 Metric Weather Map Widget
Resources Widget
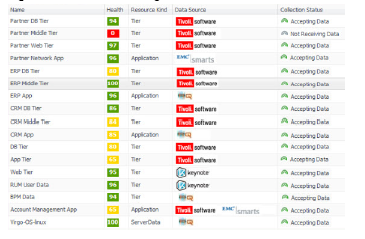
The Resources widget lists the resources that are defined in vCenter Operations Manager.
 Resources Widget
Root Cause Ranking Widget
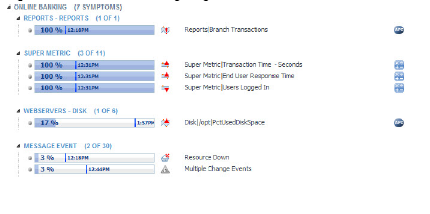
The Root Cause Ranking widget provides an instant view of the probable causes of health degradation for a selected resource. The widget shows information about metrics on related resources that contributed to alerts on the resources, including the percentage likelihood that the metric contributed to the cause.
 Root Cause Ranking Widget
Tag Selector Widget
The Tag Selector widget lists all defined resource tags and tag values. You can select one or more tag values to change the information that appears in the Alerts, Configuration Overview, Health Status, Root Cause Ranking, and Health Tree widgets.
Top-N Analysis Widget
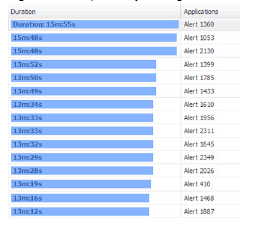
The Top-N Analysis widget lists the top five items, or another number that you specify, of a type that you select. For example, you might select the five metrics that show the highest volatility or the five most or least healthy tiers in an application.
 Top-N Analysis Widget
VC Relationship Widget
The VC Relationship widget provides performance and relationship data for objects in your virtual environment. It uses badges to represent derived metrics and give you a high-level, broad view of the performance and condition of your virtual environment.
 VC Relationship Widget
VC Relationship (Planning) Widget
The VC Relationship (Planning) widget provides use and available badge metric information (risk, time, capacity, stress, efficiency, waste, and density) for the resources in your virtual environment.
 VC Relationship (Planning) Widget
Please note:- I have got the above mentioned information from the VMware’s Enterprise Getting started Guide”.

 . Finally, we came up with an idea and created ThinApp version of IE 8 to check, if it is a problem with IE or a problem with our environment.