Badge in vCenter Operations Manager
vCenter Operations Manager uses badges to illustrate derived metrics to provide an overview of the state of the virtual environment or an individual object. These badges serve as focus points to narrow the scope of a potential problem and provide details about the cause of the problem.
vCenter Operations Manager provides major and minor badges that are color coded and range from a healthy green to a potentially problematic yellow, orange, or red.
Scores might reflect a healthy state or a potential problem depending on the type of badge. For example
- Low scores for health, time remaining, and capacity remaining might indicate potential problems.
- Low scores for faults, stress, or anomalies indicate a normal state.
There are 3 Major badges
- Health Badge
- Risk Badge
- Efficiency Badge
Health Badge
Health badge serves as the first high-level indicator of the state of the virtual environment. The Health badge indicates immediate problems that might require your attention. It helps you identify the current health of your system.
The overall health score for an object ranges from 0 (bad) to 100 (good). vCenter Operations Manager calculates the Health score using the scores of the sub-badges that the Health badge contains. The badge changes its color based on the badge score thresholds that are set by the vCenter Operations Manager administrator.
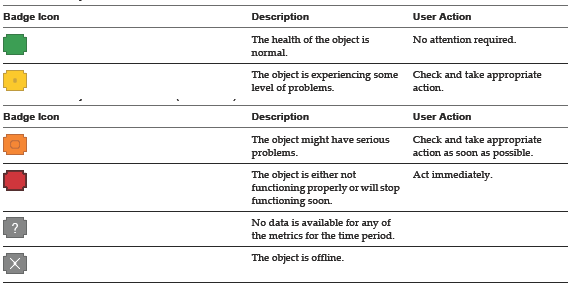 vCOPS Health Widget
There are 3 minor badge;
- Workload Badge
- Anomalies Badge
- Faults Badge
Faults are given precedence in the Health score because they describe existing problems, while Workload and Anomalies are combined to identify performance problems. This approach ensures that the score of the Health badge reflects the actual state of the object, without overexposing or underestimating problems.
Workload Badge
The vCenter Operations Manager Workload badge measures how hard an object must work for resources. A workload score of 0 indicates that a resource is not being used and a score that approaches or exceeds 100 might cause performance problems.
The Workload score ranges from 0 (good) to over 100 (bad). The badge changes its color based on the badge score thresholds that are set by the vCenter Operations Manager administrator. Both Anomalies and Workload are useful when attempting to find a probable cause and troubleshooting performance problems
 Workload badge
Anomalies Badge
Anomalies badge measures the extent of abnormal behavior for an object based on historical metrics data. A high number of anomalies might indicate a potential issue. A low Anomalies score indicates that an object is behaving in accordance with its established historical parameters. A high number of anomalies usually indicates a problem or at least a situation that requires your attention.
Both Anomalies and Workload are useful when attempting to find a probable cause and troubleshooting performance problems. The Anomalies score ranges between 0 (good) and 100 (bad). The badge changes its color based on the badge score thresholds that are set by the vCenter Operations Manager administrator.
 Anolamies Badge
Faults Badge
Faults badge measure the degree of problems that the object might experience based on events retrieved from the vCenter Server. The events that might generate faults include the loss of redundancy in NICs or HBAs, memory checksum errors, high availability failover, or Common Information Model (CIM) events, which require your immediate attention. The Faults score ranges between 0 (no faults) and 100 (critical faults). The badge changes its color based on the badge score thresholds that are set by the vCenter Operations Manager administrator.
 Faults Badge
Risk Badge
Risk badge indicates a potential performance problem in the near future that might affect the virtual environment. vCenter Operations Manager calculates the risk score using the scores of the sub-badges that the Risk badge contains. The overall Risk score for an object ranges between 0 (no risk) to 100 (serious risk).
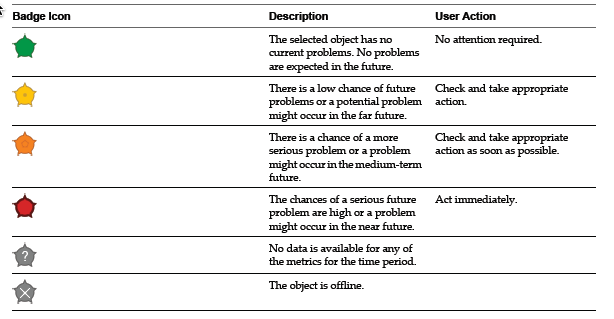 Risk Badge
Ther are 3 minor bardges under Risk Badge
- Time Remaining Badge
- Capacity Remaining Badge
- Stress Badge
Time Remaining Badge
Time Remaining badge measures the time before a resource associated with an object reaches capacity. This badge indicates the available timeframe to provision or load balance the physical or virtual resources for a selected object. The Time Remaining score ranges between 0 (bad) and 100 (good).
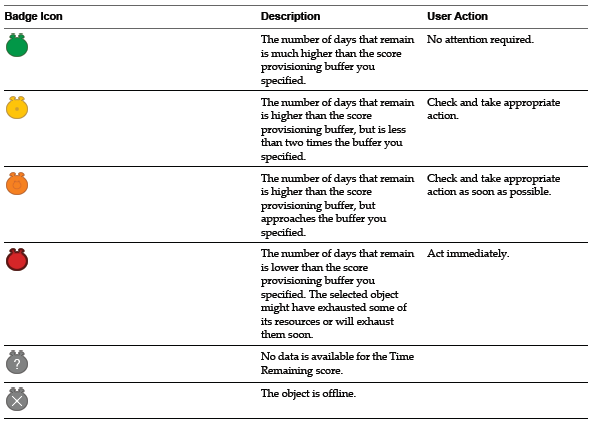 Time Remaining Badge
Capacity Remaining Badge
Capacity Remaining badge measures the number of additional virtual machines that the object can handle before reaching capacity. The remaining virtual machines count represents the number of virtual machines that can be deployed on the selected object, based on the current amount of unused resources and the average virtual machine profile for the last “n” weeks. The remaining virtual machines count is a function of the same compute resources of CPU, Mem, Disk I/O, Net I/O, and Disk Space that are used to calculate the Time Remaining score. The Capacity Remaining score ranges between 0 (bad) and 100 (good).
 Capacity Remaining Badge
Stress Badge
Stress badge measures a long-term workload that might involve undersized virtual machines or ESX hosts or an excessive number of virtual machines. These conditions might generate performance problems over time. The Stress score helps you identify hosts and virtual machines that do not have enough resources allocated, or hosts that are running too many virtual machines. A high Stress score does not imply a current performance problem, but highlights potential for future performance problems. The Stress score ranges between 0 (good) and 100 (bad).
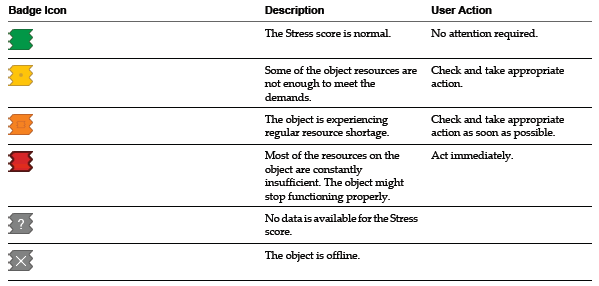 Stress Badge
Efficiency Badge
Manager Efficiency badge identifies the potential opportunities to improve the performance or cost of your virtual environment. Efficiency accounts for the waste and infrastructure density in your environment. A large amount of wasted resources combined with a low density ratio generates a poor efficiency score. The Efficiency score ranges between 0 (bad) and 100 (good).
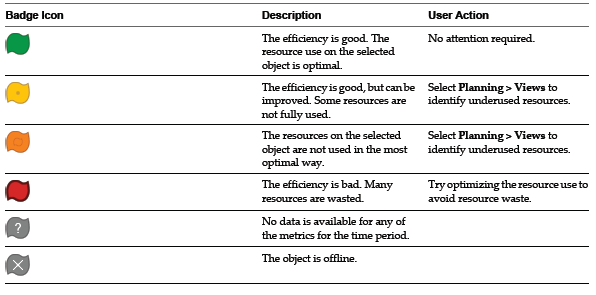 Efficiency Badge
There are 2 Badges under Efficiency Badge
- Reclaimable Waste Badge
- Density Badge
Reclaimable Waste Badge
Reclaimable Waste badge accounts for resource types such as CPU, memory, or disk, and measures the extent of excessive provisioning for an object. It also identifies the amount of resources that you can reclaim and provision to other objects in your virtual environment. The Reclaimable Waste score ranges between 0 (good) and 100 (bad).
 Reclaimable Waste Badge
Density Badge
Density badge measures consolidation ratios to assess cost savings. You can assess the behavior and performance of a virtual machine and related applications to maximize the consolidation ratio without affecting the performance or service level agreements. The Density score ranges between 0 (bad) and 100 (good).
 vCOPS Density Widget


Leave a Reply