One of the key resource of VM is CPU performance. If the performance is a bottleneck it can be attributed to storage, network, memory and CPU.
Physical CPU load is generated by
- Guest OS running inside the VM
- Application running in the VM
- Agents running on ESX Server on pCPU0
Majority of the load on the ESX/ESXi servers are attributed to the above conditions. A good understanding of applications and how to use VI Client OR Esxtop will go a long way to troubleshoot any performance related problems.
Factors that Affects CPU Performance
- CPU Affinity – Using CPU affinity has a positive effect for VM being pinned to a vCPU. However for the entire system as a whole, CPU affinity constrains the scheduler and can cause an improperly balance load.
- Idle Virtual Machines
- SMP virtual machines
- If CPU contention exists, the scheduler forces vCPUs of lower priority VM to queue their CPU requests in deference to higher-priority VMs.
CPU Metrics to Monitor
- Host CPU Usage – Amount of time that the host's CPU (physical CPU) was used during normal sampling period
- VM CPU used – Amount of time that the virtual machine’s CPU (vCPU) was actively using the physical CPU. For virtual SMP virtual machines, this can be displayed as an aggregate of all vCPUs in the virtual machine or per vCPU.
- VM CPU Ready Time – Amount of time that the virtual machine’s CPU (vCPU) was ready but could not get scheduled to run on the physical CPU. CPU ready time is dependent on the number of virtual machines on the host and their CPU loads.
What is a World
A VM is a collection of worlds, with some worlds being virtual CPUs (vCPUs) and other thread doing additional work. For example, a VM consists of a world that controls the mouse, keyboard and screen (MKS). The VM also has a world for its virtual machine monitor (VMM).There are non–virtual machine worlds as well. These non–virtual machine worlds are VMkernel worlds and are used to perform various system tasks. Examples of these non–virtual machine worlds include the idle, driver, and vmotion worlds.
ESXTOP
We can either use the esxtop from the ESX console OR via RCLi i.e resxtop. They both perform in the similar manner. By default, the vSphere Client uses a sampling interval of 20 seconds and resxtop/esxtop uses a sampling interval of 5 seconds.To convert time values to percentages, divide the time value by the sample interval. For the vSphere Client, the default sampling interval is 20 seconds (or 20,000 milliseconds).
To start ESXTOP from the cmd line in ESX Server type :– esxtop
By default the display starts with CPU resource utilization. It is bit cryptic, knowledge about Physical hardware in terms of CPU/memory will be helpful here but it is not necessary.
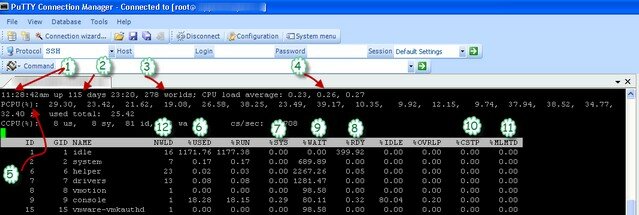
The above image gives us interesting information about the CPU utilization of this ESX Server
- The current time on the system
- The number of days since this ESX box is rebooted
- Number of Worlds on this box. (A world is an ESX Server VMkernel schedulable entity, similar to a process or thread in other operating systems. A group contains multiple worlds.)
- The Avg CPU load in last 5, 10 and 15 mins. A value of 1 in any of these three fields indicates that the physical CPU is fully utilized and a value greater than 1 indicates that the host requires more physical CPU capacity than is available. For example a value of 2 means that host potentially needs twice the amount of physical CPU resources that were available at the indicated time
- The PCPU (%) shows utilization for the Physical processor on the host by core. It provides a real time view of the host's Physical CPU utilization. If these figures are consistently showing between 90% and 100% for prolonged periods of time, this indicates that the CPUs on the host are probably oversubscribed
- %USED – CPU Utilization. The virtual machines are reported here with the names specified at the time they were created. As with the idle world’s row, utilization for each virtual machine can exceed 100 percent. A virtual machine that uses two virtual CPUs, for example, can show up to 200 percent CPU utilization
- %SYS – Percentage of time in the ESX VMkernel on behalf of the world/resource pool to process interrupts and to perform other system activities
- %RDY – Percentage of time the group was ready to run but was not provided CPU resources on which to execute
- %WAIT – Percentage of time the group spent in the blocked or busy wait state. This includes the percentage of time the group was idle.
- %CSTP – Percentage of time the vCPUS of a VM spent in the co-stopped state, waiting to be co-started. This gives an indication of the co-scheduling overhead incurred by the VM. If this value is low, then any performance problems should be attributed to other issues and not to the co-scheduling of the VM's vCPU
- %MLMTD – Percentage of time the VMkernel did not run the resource pool/world because that would violate the resource/pool/worlds limit setting
- NWLD – Number of worlds associated with a given group
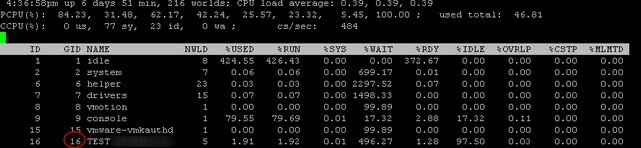
Expanding the Group (Showing worlds associated with each VM)
You can expand the group data for a VM you want to examine in more detail. To do so, press “e” then enter the group ID number (shown in the GID column) for the VM.
For ex in the below image, we will expand the VM with GID – 16
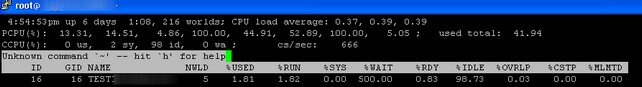
After expanding gid 16

The above screen capture includes following information. Each VM will compromise of at least the following basic worlds.
- vCPU-# – This world assists the VM with its vCPU. One vCPU world is allocated for each vCPU assigned to the VM. For example, a dual vCPU VM would have two VMX worlds, vcpu-o and vcpu-1.
- VMware-VMX – The vmx world assists the vCPU world outlined in the preceding point
- MKS – This world assists in mouse, keyboard and screen
- VMAssistant – This is a new world that handles memory scanning and TPS (Transparent Page Sharing)
To View CPU metrics per VM
If you want to view CPU metrics per VM – Type “V”
Basic Troubleshooting Flow for CPU Saturation
- Check for Host CPU Saturation
- Check for Guest CPU Saturation
- Check for using only one vCPU in an SMP VM
- Check for low guest CPU utilization
- Check for high utilization on PCPU0
ESXTOP values for Ready time
Using resxtop/esxtop values for ready time, here is how to interpret the value:
-
If ready time <= 5 percent, this is normal. Very small single-digit numbers result in minimal impact to users.
-
If ready time is between 5 and 10 percent, ready time is starting to be worth watching.
-
If ready time is > 10 percent, though some systems continue to meet expectations, double-digit ready time percentages often mean action is required to address performance issues.
Spotting CPU Overcommitment
Remember, high %RDY values and High %Used values are sure indicator that your CPU resources are overcommited
Guest CPU saturation
Guest CPU saturation occurs when the application and the OS running within a VM use all of the CPU resources that the ESX host is providing to that VM. The occurrence of guest CPU saturation does not necessarily indicate that a performance problem exists, Compute-intensive applications commonly use all available CPU resources.
There are two approach to solve this performance problem
-
Increase the CPU resources provided to the application, by adding more vCPU
-
Increase the efficiency with which the VM uses CPU resources
Single vCPU vs Multiple vCPUs
Take a cautious approach to allocating multiple vCPUs to a VM, as you can create extra overhead by scheduling two or more vCPUs in a VM, which would be detrimental to the performance of the VM.
To determine if multiple vCPUs assigned to your VM is causing poor performance:
- Open a console prompt on the ESX host or initiate an SSH connection to it. .
- Type esxtop and press Enter.
-
On the CPU screen, check the %CSTP value. If this number is higher than 100, the performance issues may be caused by the vCPU count. Try lowering the vCPU count of the virtual machine by 1.
Note: The %CSTP value represents the amount of time a virtual machine with multiple virtual CPUs is waiting to be scheduled on multiple cores on the physical host. The higher the value, the longer it waits and the worse its performance. Lowering the number of vCPUs reduces the scheduling wait time.
- Right-click on the virtual machine and click Edit Settings.
- Click CPUs.
- Use the Number of virtual processor drop-down to lower the vCPU count by 1.
- Click OK.
-
If your virtual machine still experiences performance issues, and if its kernel or HAL can handle switching to a single vCPU, lower the vCPU count to 1.
Warning: If your virtual machine's kernel or HAL cannot handle switching to a single vCPU, unexpected behaviour may occur.
The above information is from VMware's website – http://kb.vmware.com/kb/1005362
Low Guest CPU Utilization
If the average usage < 75 percent, guest CPU utilization is low, there can be various reasons behind this
- High Storage response time
- Poor application OR OS tuning
- Application pinned to cores in guest OS
- Too many configures vCPUs
- Restrictive resource allocations
High utilization on PCPU0
If usage on PCPU0 > 75 percent and it is more than 20 percent greater than overall host usage, then there is possible high utilization on PCPU0. To solve this
- Reduce the number of management agents
- Reduce the amount of work performed by management agents
- Ensure management agents are up to date
Most of the above information is gathered from VMware's Knowledge base, VMworld and from forums


badmash
/ October 23, 2010I just signed up to your blogs rss feed. Will you post more on this subject?
vcpguy
/ October 23, 2010Yes, few more of them are on its way.
mackdaniel
/ October 24, 2010this was a really nice post, thanks
quinny kinderwagen
/ November 4, 2010There is obviously a lot to know about this. I think you made some good points in Features also.
Keep working ,great job!
chakradhat Narayana
/ November 4, 2010Nice post!!
Rajesh Vasadi
/ June 28, 2015Nice Article. Thanks. Please share if memory and network related also.
Dena
/ November 4, 2016I see interesting articles here. Your website can go viral easily,
you need some initial traffic only. How to get it? Search for: ricusso’s
methods massive traffic
Honest Loans
/ January 30, 2017Paragraph writing is also a excitement, if you be acquainted with after that you can write otherwise it
is difficult to write.
Genesis Renew Cream Review
/ January 31, 2017Hi there everyone, it’s my first pay a visit at this site,
and post is in fact fruitful for me, keep up posting these posts.